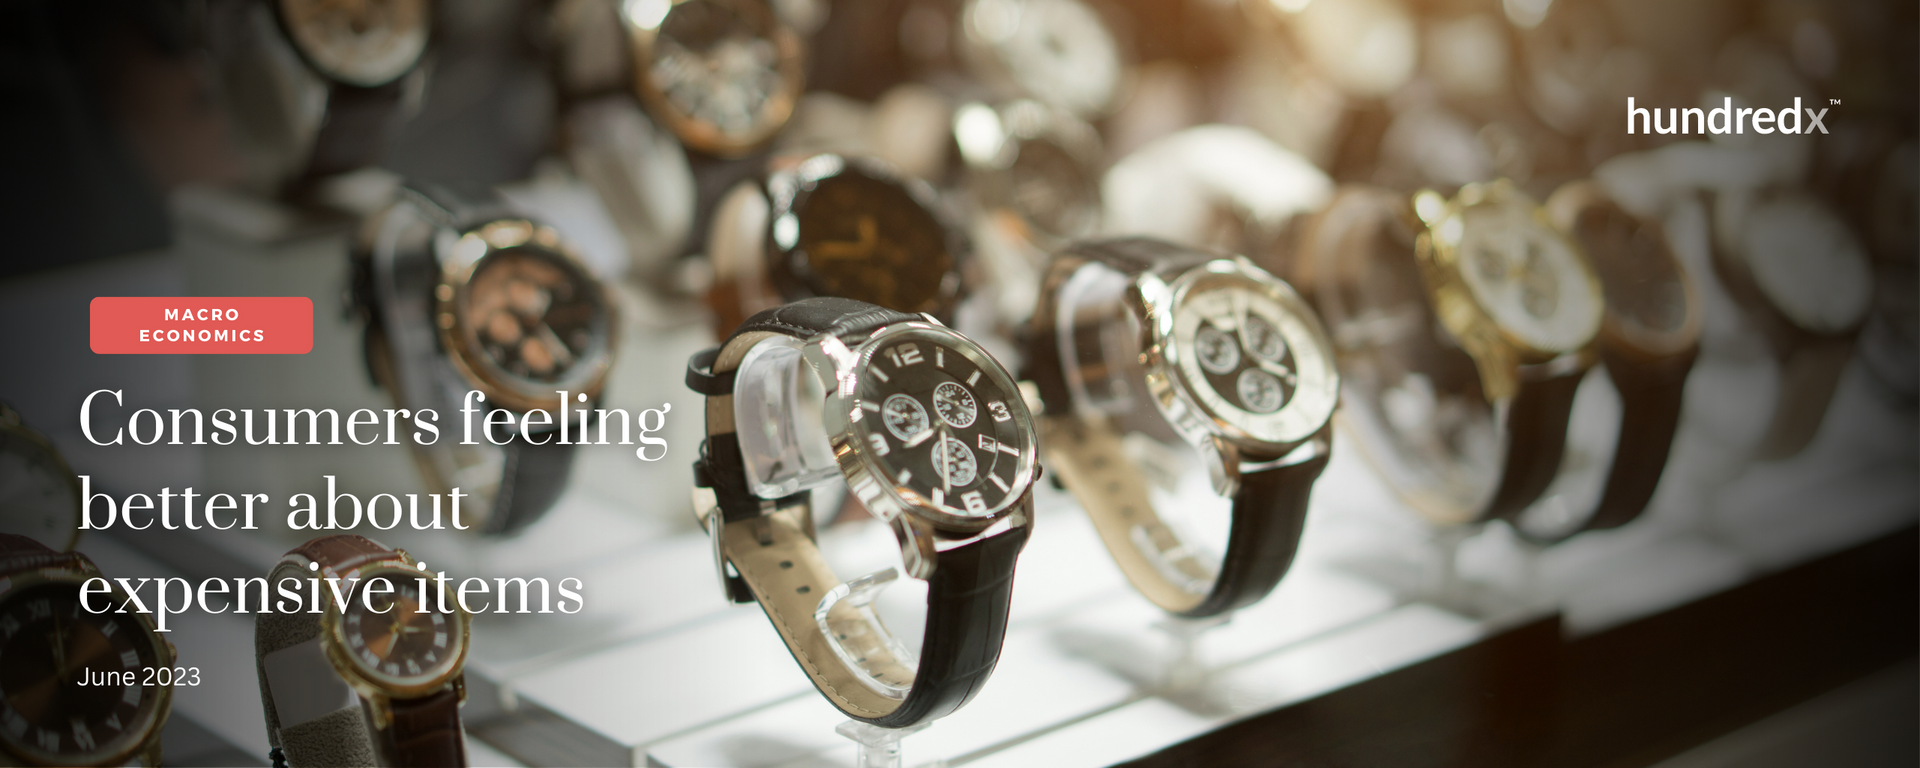
Consumers feeling better about expensive items
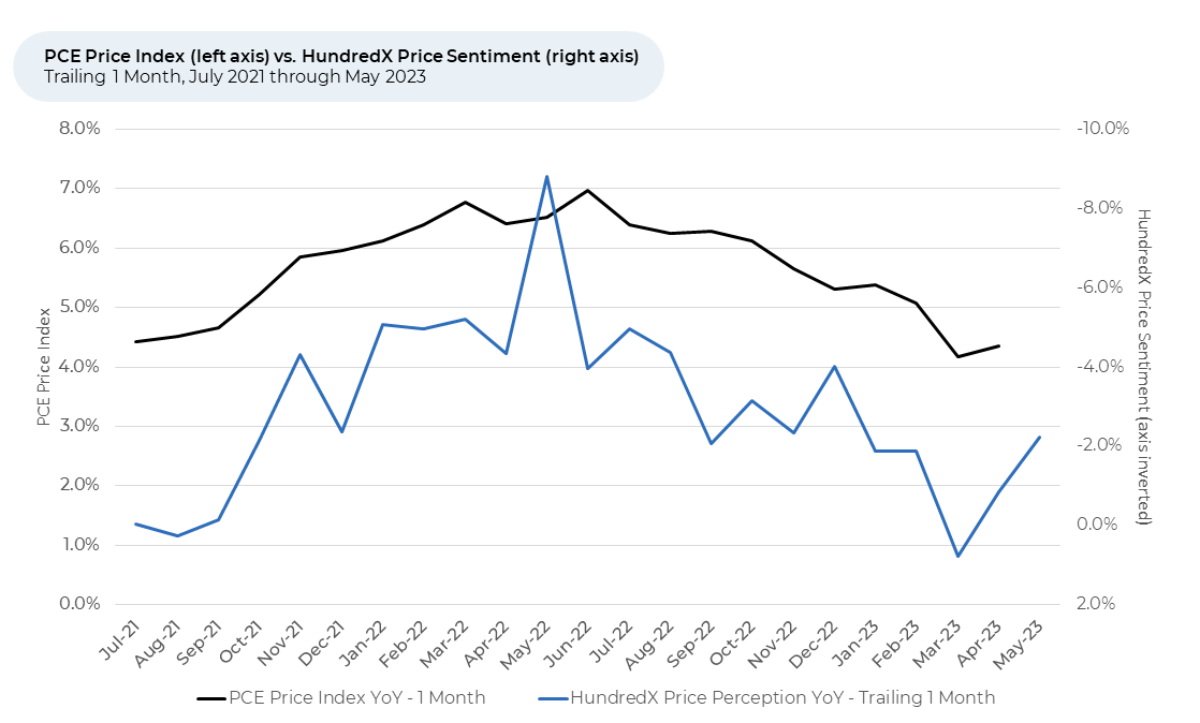
- Price sentiment fell for the second consecutive month in May. We have found changes in HundredX’s Price sentiment ¹ , ² index typically inversely correlate with movement in the Personal Consumption Expenditures (PCE) Price levels (i.e. inflation) reported by the US government.
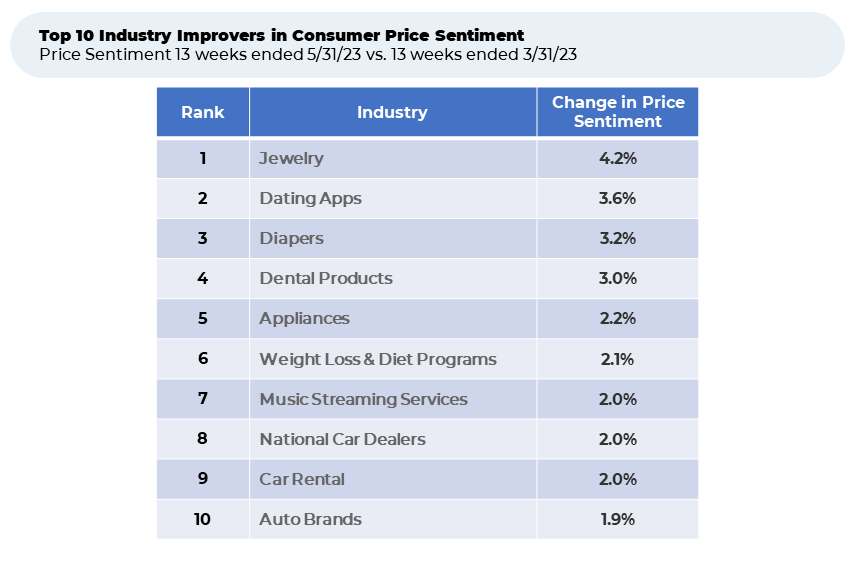
- In the last two months (when aggregate sentiment has fallen), sectors selling expensive items, such as jewelry, cars, and appliances, were among the top 10 improvers in Price sentiment.
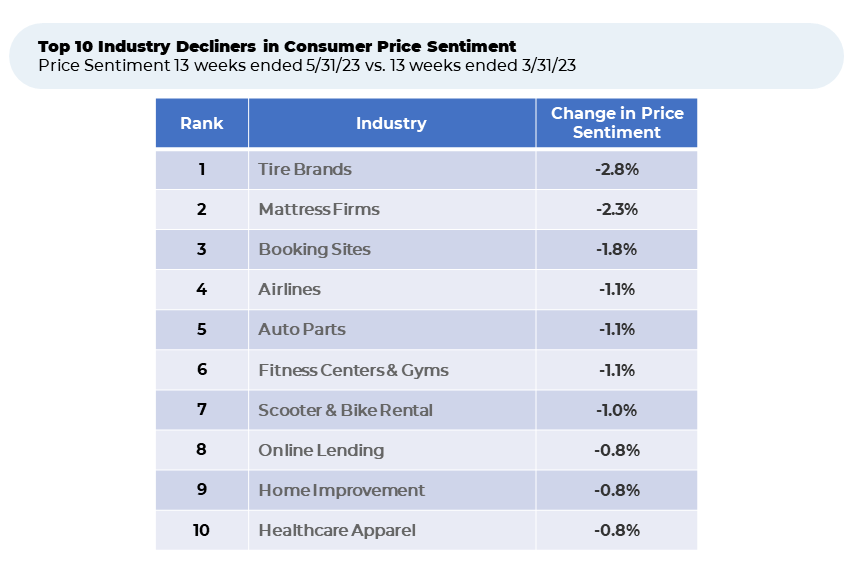
- Over the same two months, travel and transportation, home-related and car parts industries accounted for most of the top 10 decliners in Price sentiment.
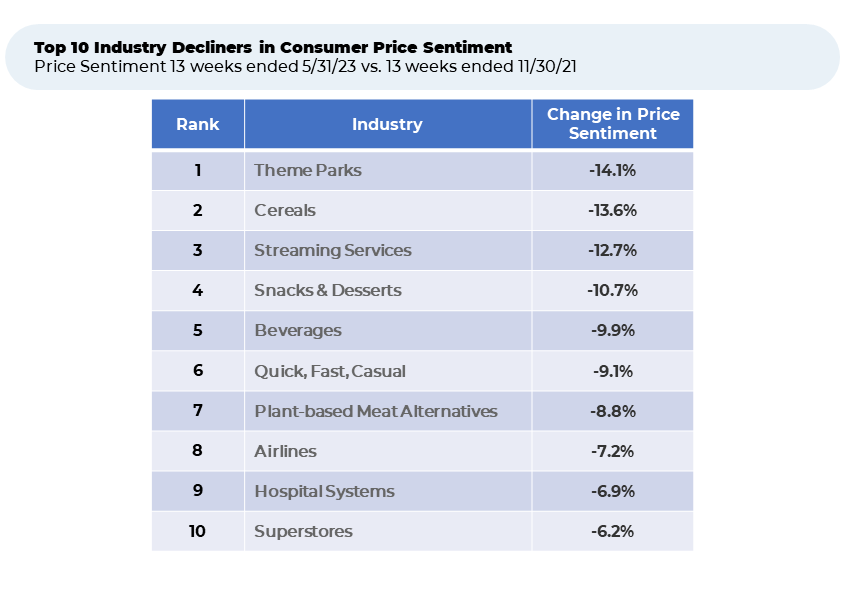
- Taking a look back over the most recent period of record inflation, food-related sectors accounted for 5 of the top 10 declines in Price Sentiment in May 2023 vs. 18 months before.
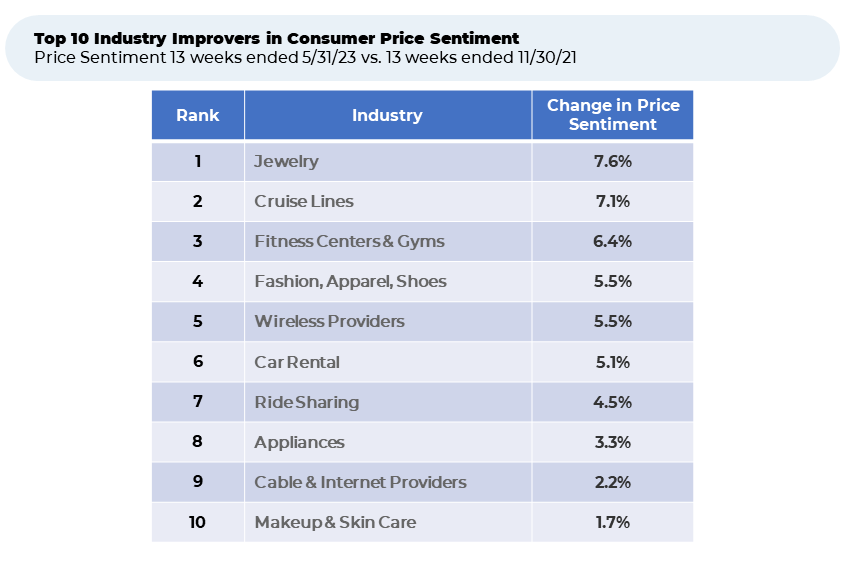
- Industries heavily affected by the pandemic (such as cruises and fitness centers), some discretionary items and utilities like cell phones and cable saw the biggest Price sentiment improvements the last 18 months.
HundredX sees movement in Price Sentiment before inflation gets reported
Over much of the past year there had been a steady improvement in Price sentiment through March 2023, before it declined modestly in April and again in May. This trend inversely aligns with movement in the PCE Price index, which rose from July 2021 to a June 2022 peak before moderating most of the last year. The May 2023 PCE Price Index reading will be released June 30. The recent decline in price sentiment observed in the past two months indicates there are signs of consumer discontent resurfacing, particularly as economic growth decelerated in 1Q 2023 and inflation remains above historical levels. We take a closer look at the industries that have seen sentiment improve and decline most.
Vehicle maintenance and summer travel causing recent declines in Pric
e Sentiment
Food-related industries hit hard in 2022 continue to decline
Many industries beat up by the pandemic saw strong price sentiment bounce back
Big ticket items showing improvement in Price Sentiment in Recent Months
- All metrics presented, including Net Positive Percent / Sentiment are presented on a trailing three-month basis unless otherwise noted.
- HundredX measures sentiment towards a driver of customer satisfaction as Net Positive Percent (NPP), which is the percentage of customers who view a factor as a positive (reason they liked the products, people, or experiences) minus the percentage who see the same factor as a negative.
Strategy Made Smarter
HundredX
works with a variety of companies and their investors to answer some of the most important strategy questions in business:
- Where are customers "migrating"?
- What are they saying they will use more of in the next 12 months?
- What are the key drivers of their purchase decisions and financial outcomes?
Current clients see immediate benefits across multiple areas including strategy, finance, operations, pricing, investing, and marketing.
Our insights enable business leaders to define and identify specific drivers and decisions enabling them to grow their market share.
Please contact our team to learn more about which businesses across 75 industries are best positioned with customers and the decisions you can make to grow your brand’s market share.
HundredX is a
mission-based data and insights provider
. HundredX does not make investment recommendations. However, we believe in the wisdom of the crowd to inform the outlook for businesses and industries. For more info on specific drivers of customer satisfaction, other companies within 75+ other industries we cover, or if you'd like to learn more about using Data for Good, please reach out:
https://hundredx.com/contact
.
Share This Article