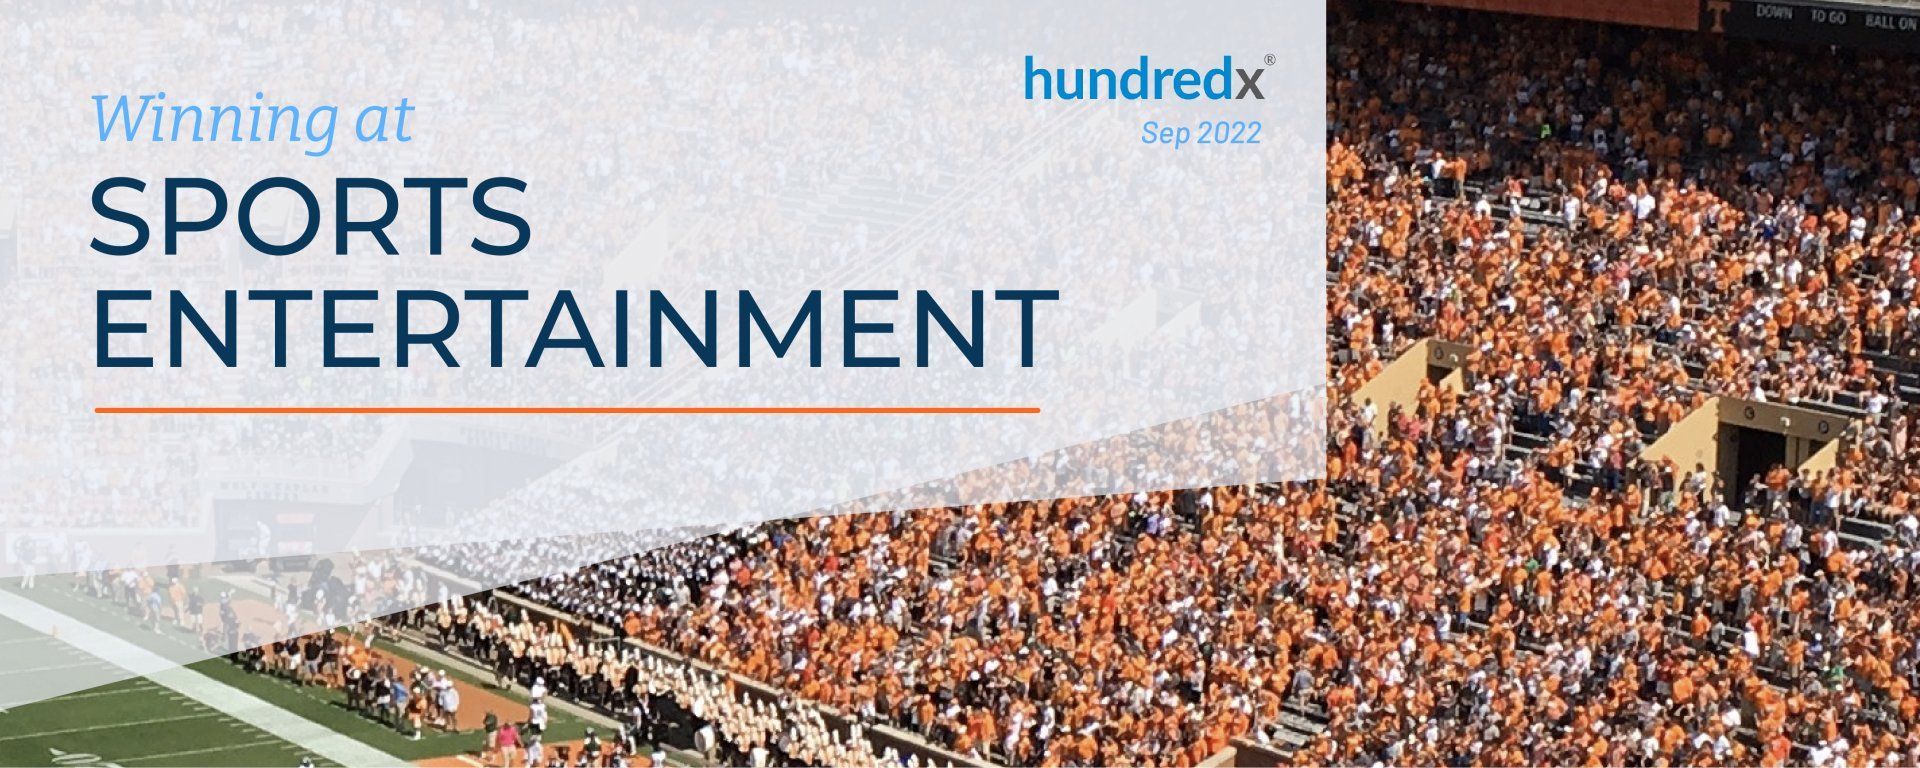
Winning at Sports Entertainment: Racing to Capture Consumers' Attention
In the race against mass media to capture consumers’ attention, Sports Entertainment pulls ahead.
We leverage our insights from “The Crowd” – real consumers that watch and attend sporting events who share immediate feedback with HundredX – to understand the evolving demand for Sports Entertainment and which leagues are navigating it best. Examining more than 57,000 pieces of consumer feedback on 14 of the most popular sports in the U.S. since January 2021, we find they still play an important role in consumers’ interests. We also find American’s interest in Formula One has skyrocketed during the past year. All data is captured using HundredX’s proprietary listening methodology.
Recent Indicators from "The Crowd"
HundredX data and analysis shows demand
growth
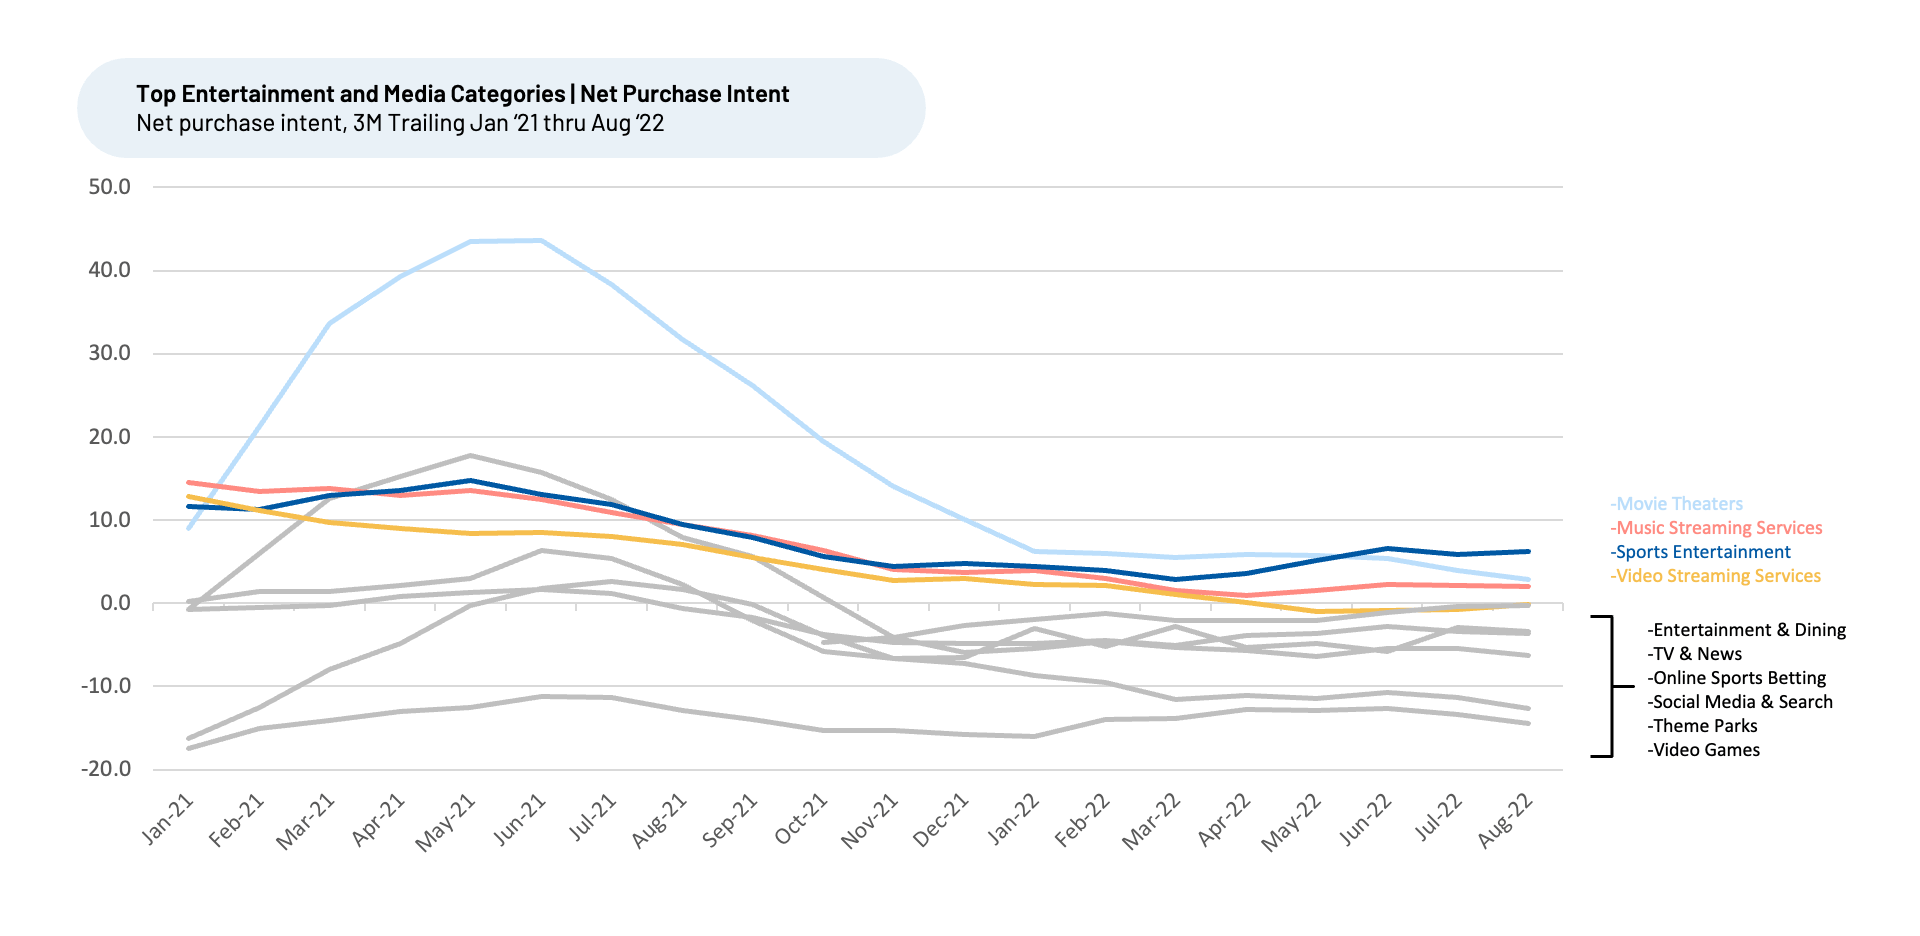
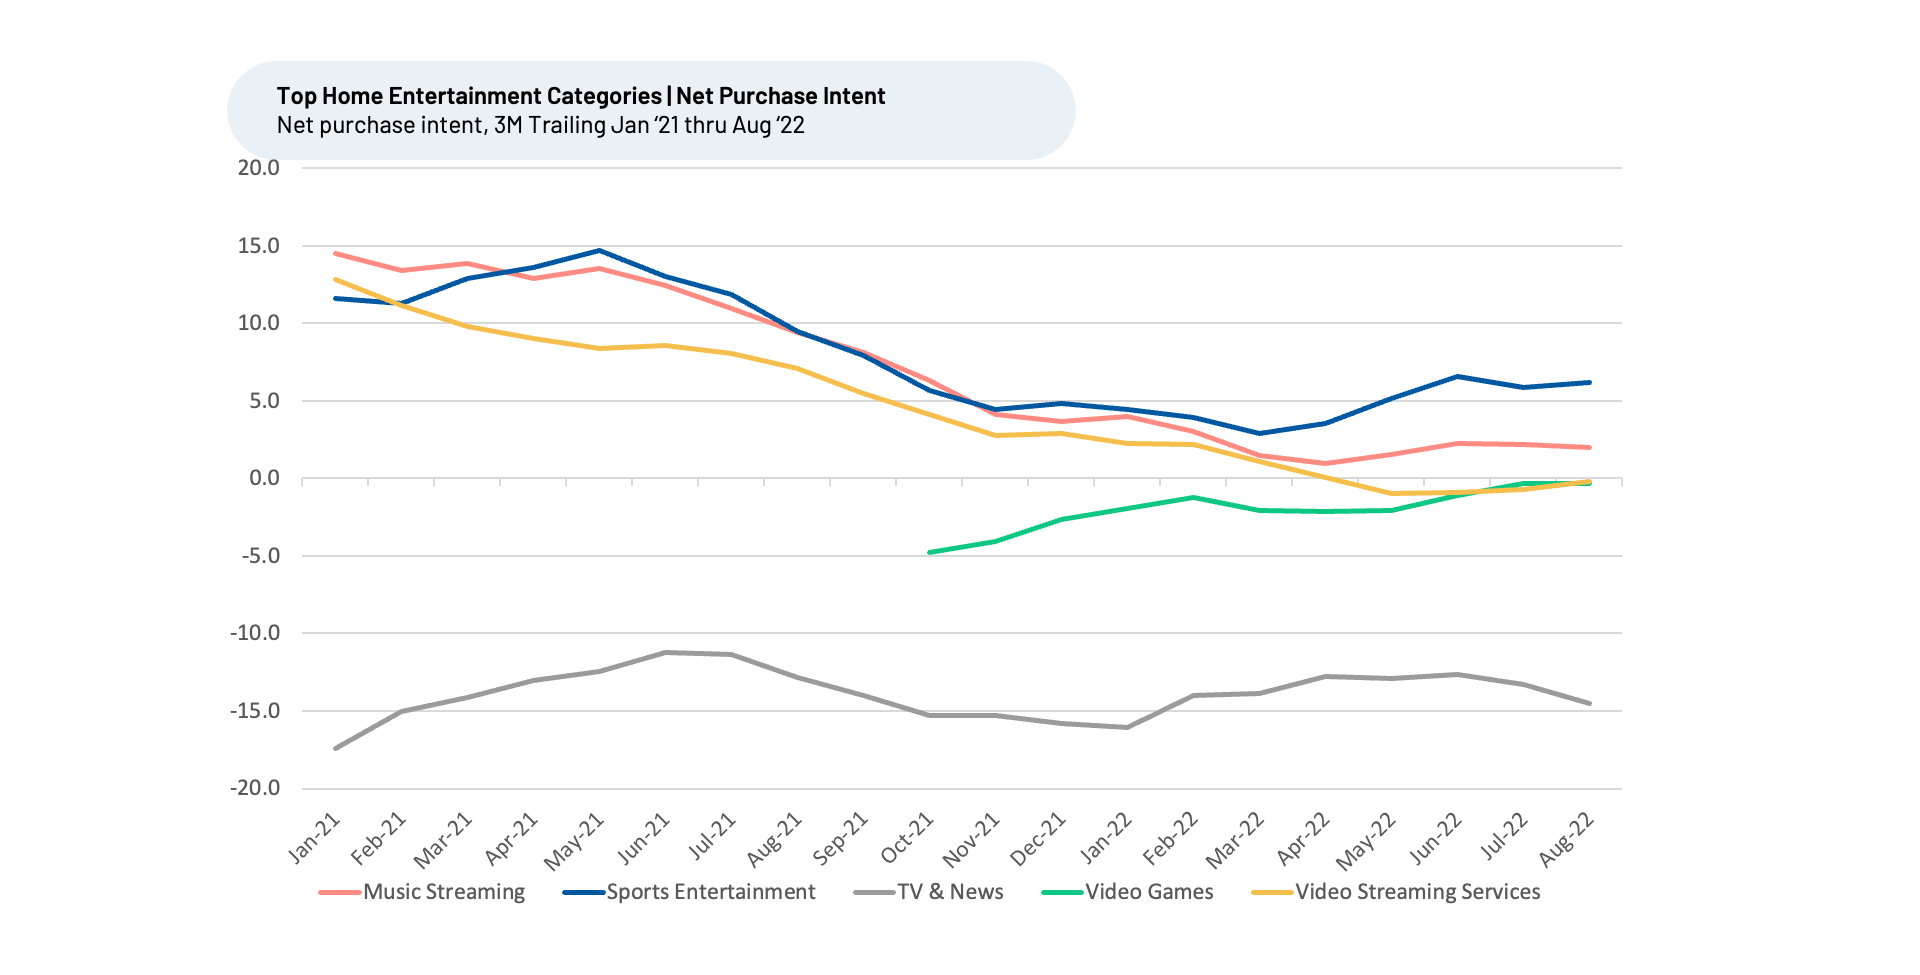
for Sports Entertainment has held up very well this year relative to other forms of entertainment since January 2021, despite inflation and the other headwinds facing consumers. Sports Entertainment is the only entertainment category we cover that has both positive trailing three months (T3M) Future Net Purchase Intent (NPI) for August 2002 (6%) and is up versus January 2022 (when T3M was 5%). NPI for the entertainment categories reflects the percentage of customers who plan to engage more with a type of entertainment over the next 12 months minus the percentage that intends to engage less.
Sports Entertainment NPI has climbed steadily since June 2022, now sitting ahead of all forms of entertainment, including theme parks and movie theaters, and at-home forms such as streaming services, video games, and social
media
. Sports took the lead over Movie Theaters (3% NPI for T3M August 2022) in July after Movie Theater NPI crashed from a peak of 44% T3M June 2021. Demand for movie theaters normalized after the surge in summer 2021 from re-opening after COVID-19 cases eased.
We find that much of the HundredX feedback collected across all sports categories has commented on the high cost of attending live games or the cost of TV packages to view out-of-area games. One leading sports league fan noted that “Games should be affordable for families.” Another said the the league subscription pacakage “… costs too much.”
TV & News is likely to sustain the weakest demand growth for the group, with video streaming services driving people to cut the cord on traditional cable packages.
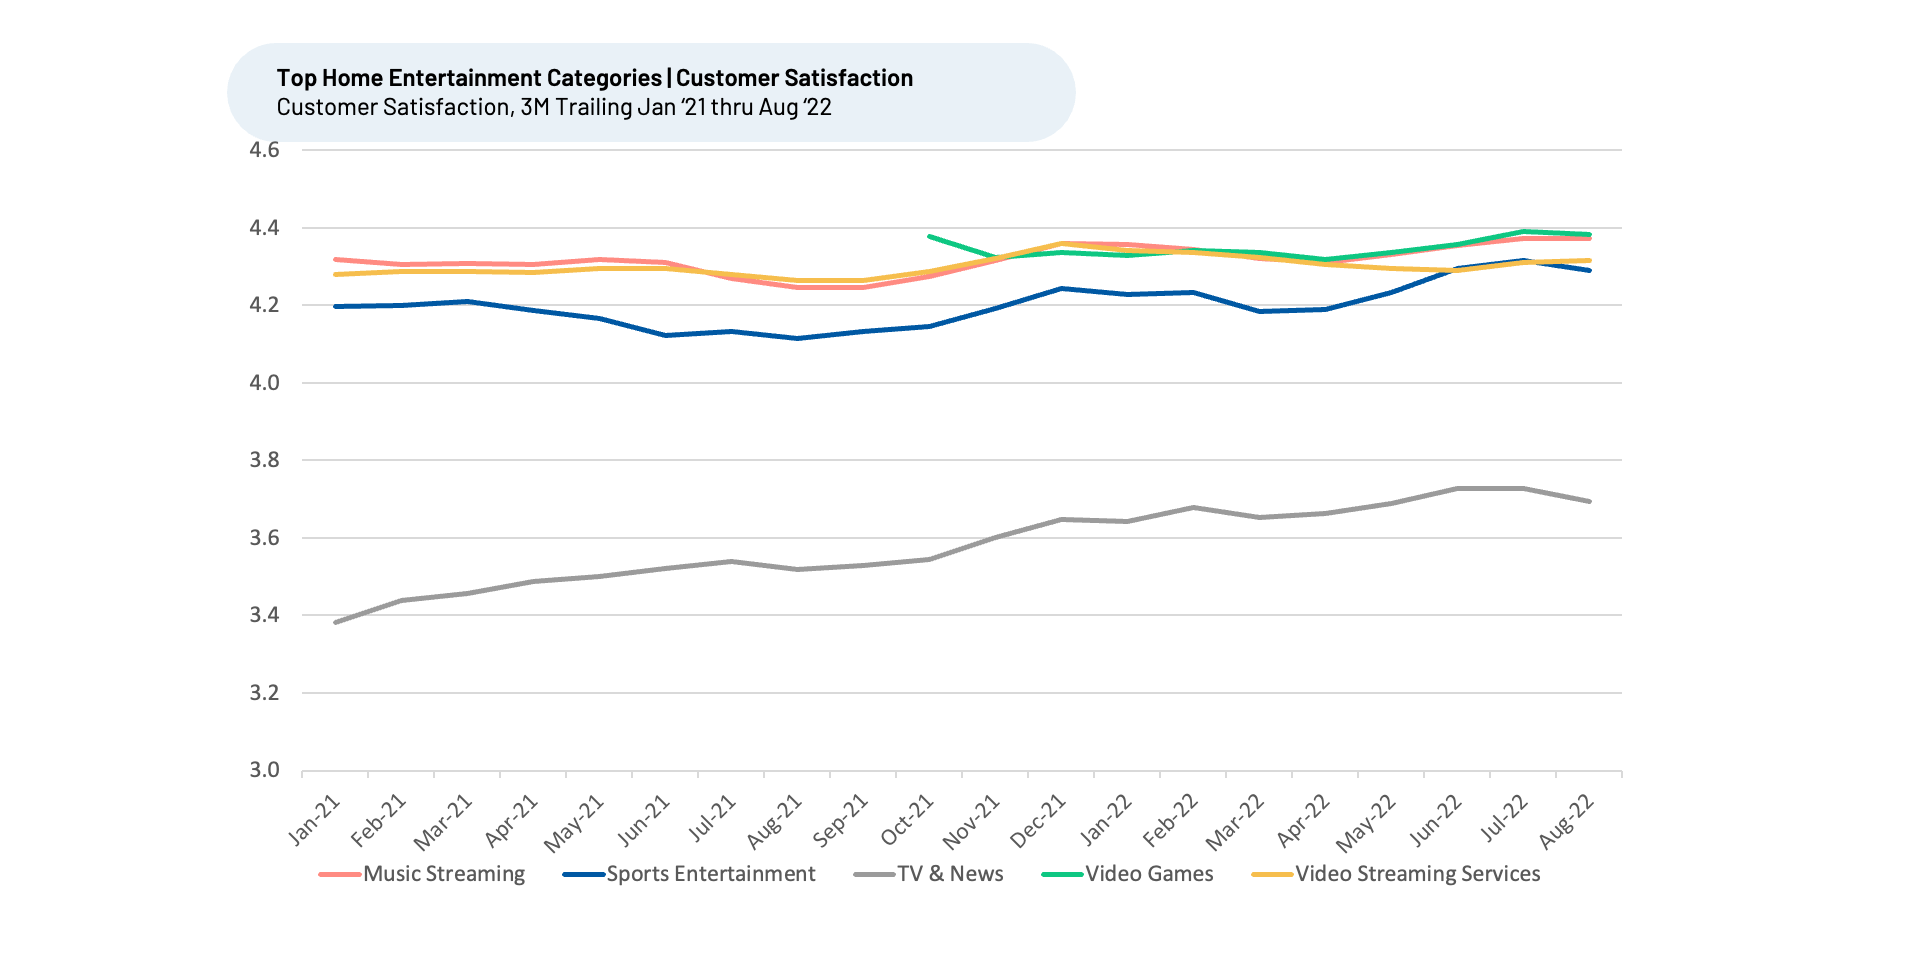
Interestingly, while the demand growth outlook appears to be more favorable for Sports Entertainment relative to other home entertainment categories, each category does a comparable job of making the customers happy – except for TV &
News
.
A Winning Formula for Sports Entertainment (Sports Leagues)
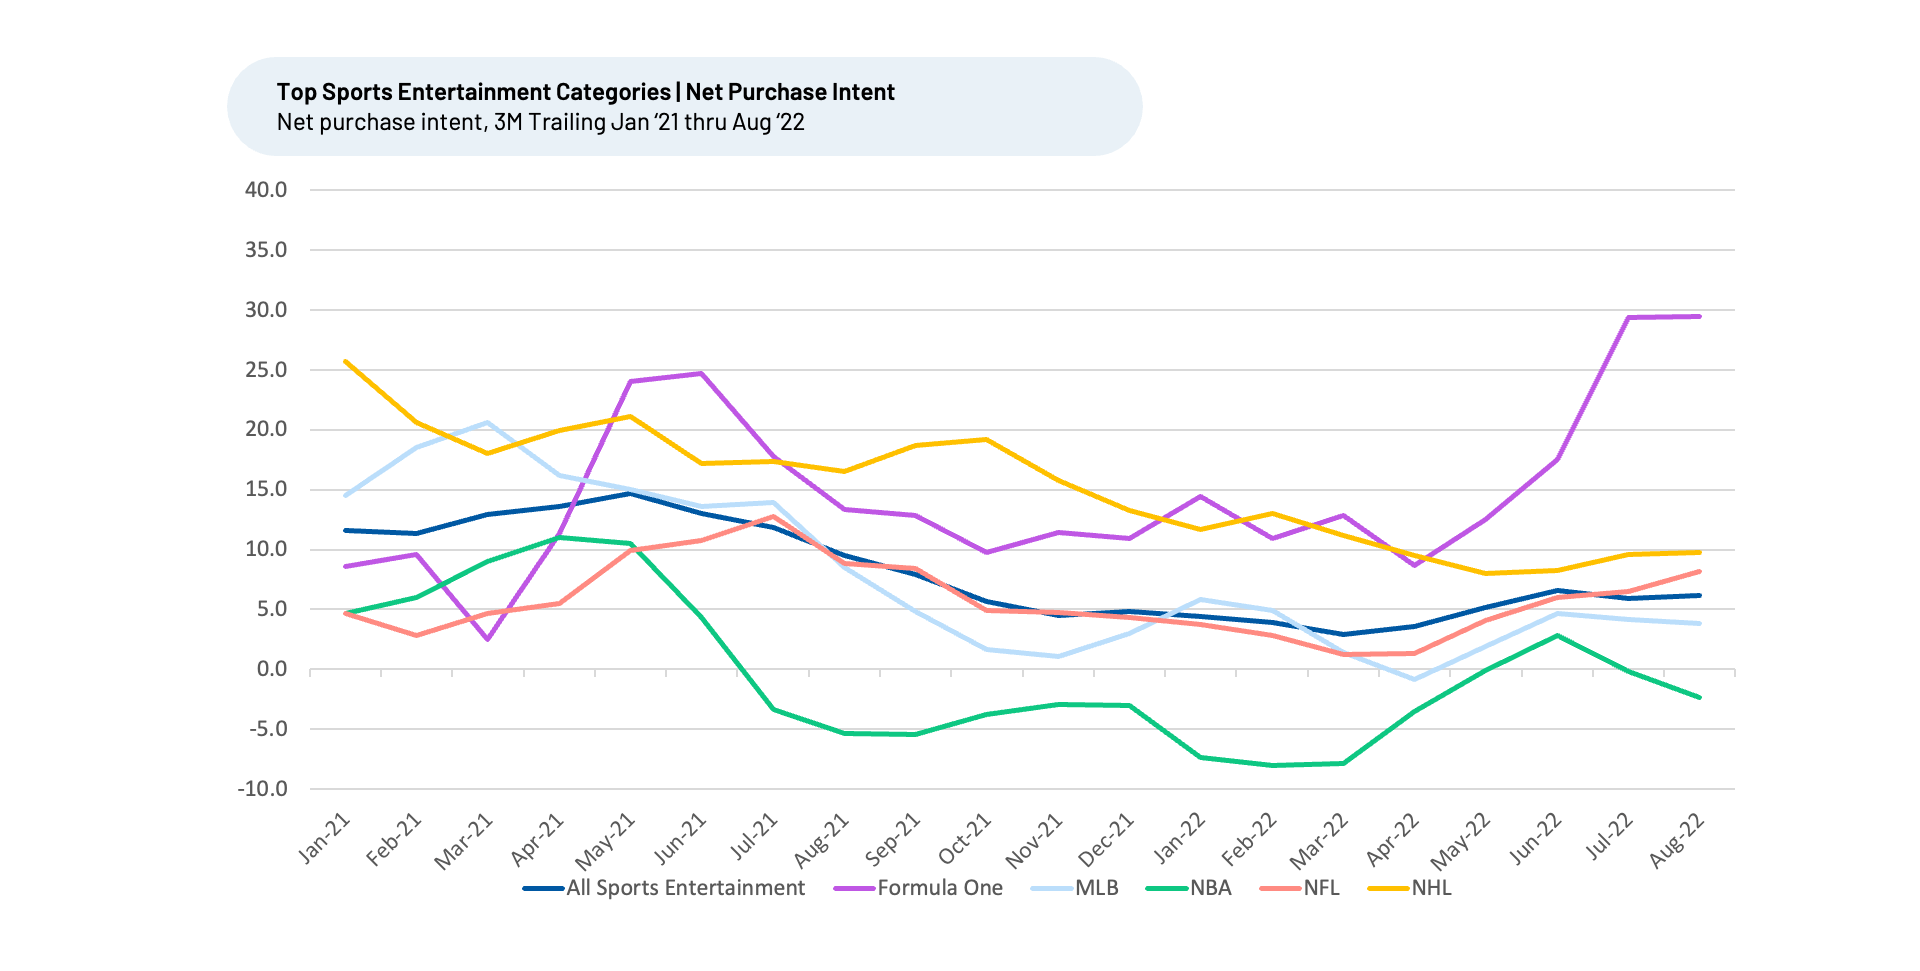
Looking at NPI trends, we find the NHL has sustained the strongest NPI of the four “major” US sports leagues (MLB, NBA, NFL, NHL) over most of the last two years, followed by the NFL. Beyond the four “major” leagues, we saw even stronger NPI for Major League Soccer (MLS), Premier League Soccer, and the WNBA, with Formula One racing being the breakout star surging from NPI of 9% for T3M April 2022 to 30% for T3M August 2022, the highest of all the leagues we follow.
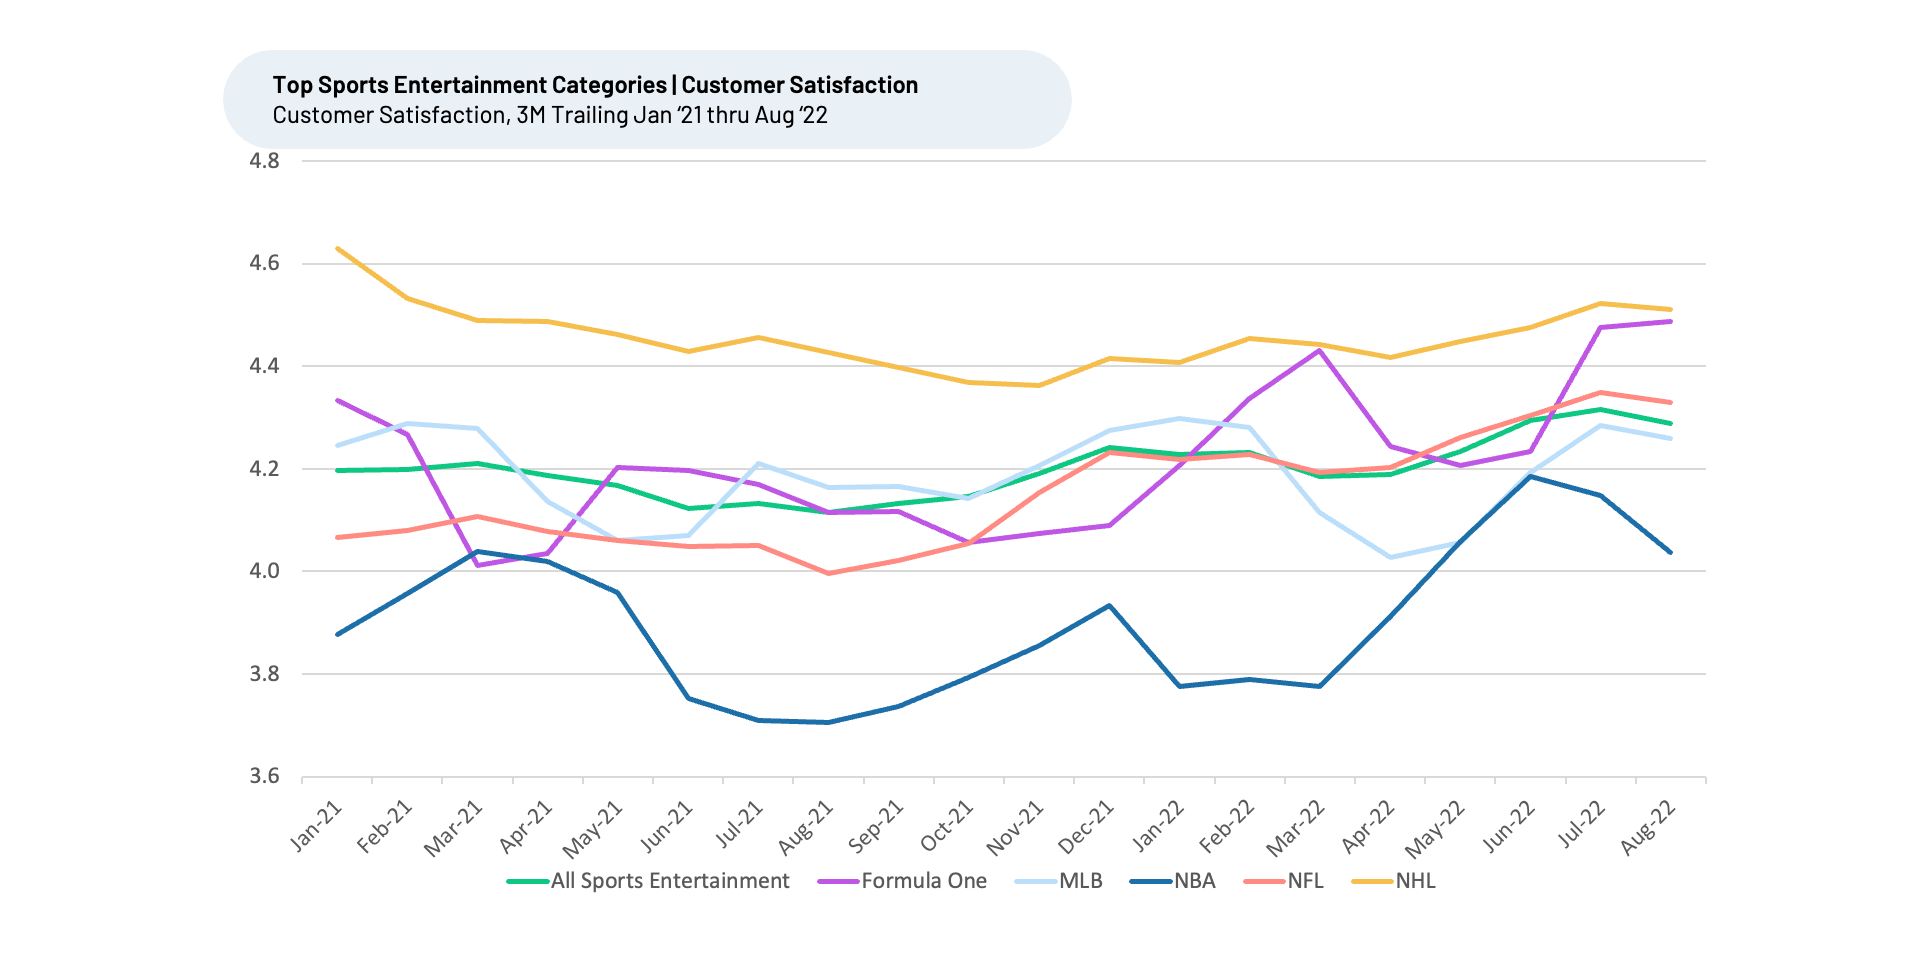
We look to understand why these brands beat the competition concerning customer intent to engage more, digging into specific purchase intent drivers. Our analysis indicates sports leagues with the best Customer Satisfaction (CSAT) tend to do a better job than the peer group at delighting customers with their Athletes / Stars, Entertainment, and Live Events / Games.
The leagues that see relative improvements in these metrics tend to see the biggest increases in NPI – as with Formula One.
We remind you that NPI is an indicator of future trends in demand growth and market share shifts, not absolute levels of demand, given it is derived from customer feedback on whether they expect to follow a sport more, less, or about the same over the next twelve months. Thus, Formula One and the NHL having stronger NPI than the NFL and NBA, indicating those leagues are poised to enjoy better growth, not that they generate higher revenue overall.
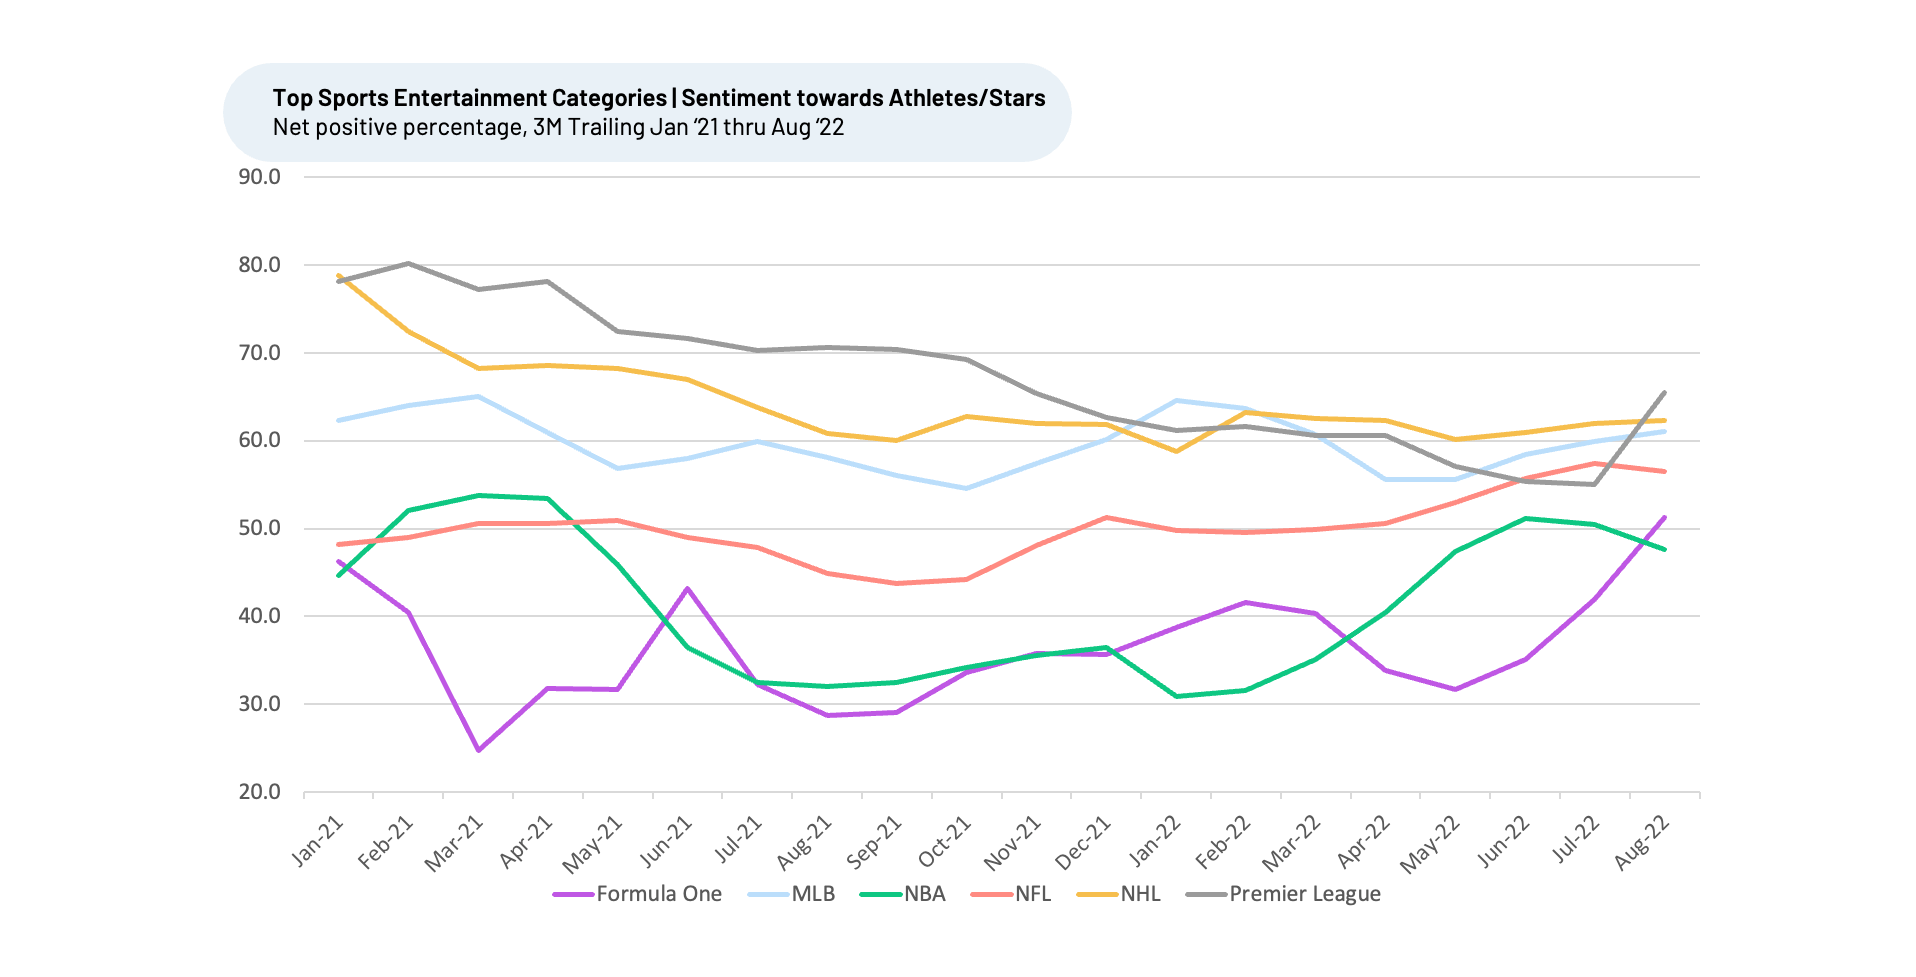
Athletes and Stars
While all leagues under coverage have impressive rosters of stars, The Premier League is the one showed it is winning with “Athletes / Stars” Customer Satisfaction. Sentiment or satisfaction towards a particular driver is measured using Net Positive Percentages (NPP), which represents the percentage of customers who view a factor as a positive (reason they liked the products, people, or experience) minus the percentage who see the same factor as a negative.
Unsurprisingly, given that the Premier League begins in August, it saw its NPP for “Athletes / Stars” spike from 55% T3M July 2022 to 66% T3M August 2022, well ahead of the peer group average of 55%. An international sport and one of the world’s most watched, soccer boasts stars recognizable by people from many different countries. While the Premier League only consists of English teams, the teams play worldwide, gaining a following
worldwide
. “Great level of play,” one person said to HundredX. “Good athletes and players.”
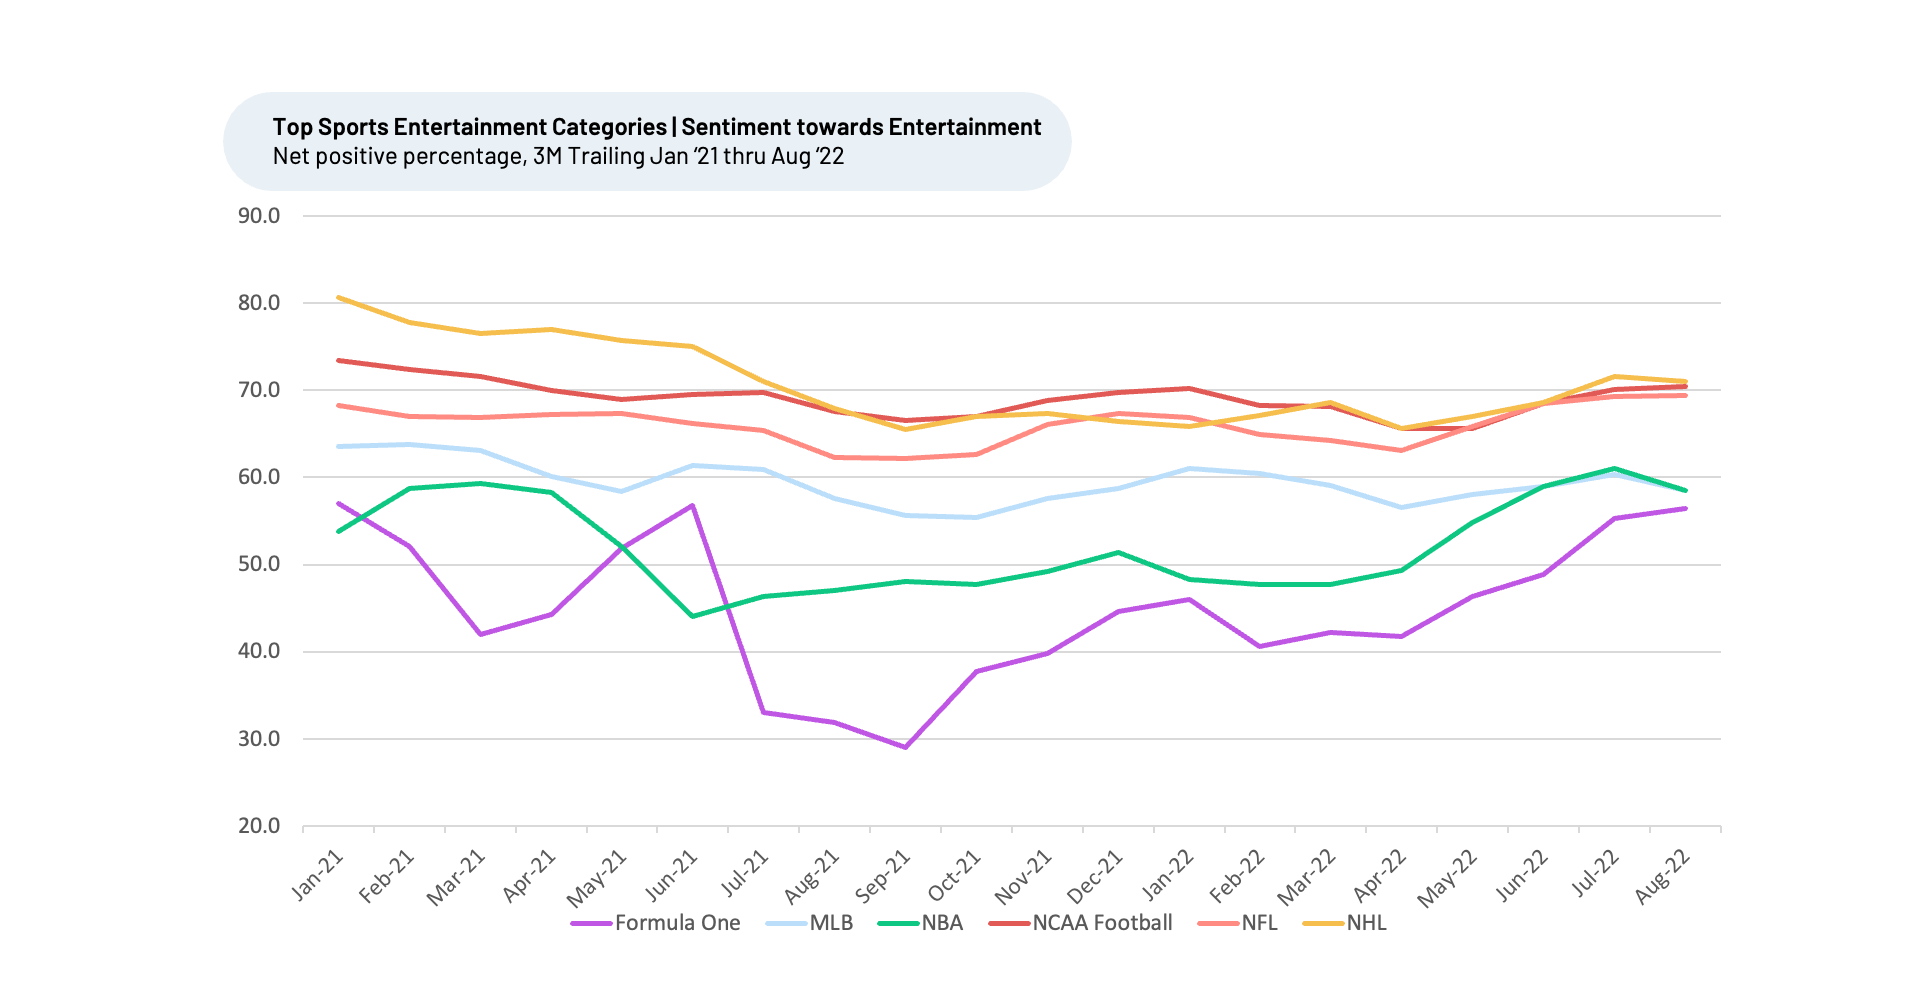
Entertainment
Known for its rough play and frequent fights, the NHL also ranks highest in sentiment towards “Entertainment”, with NPP of 71% for T3M August 2022, well ahead of peer group average of 63%. Apparently, when it comes to “Entertainment,” people want to see hard-hitting plays and action ― NCAA Football and the NFL fall just behind the NHL in this driver, with NPPs of 71% and 69% respectively.
One fan of the NHL told HundredX, “Hockey is a lot of fun to watch due to the speed of the game and the aggressive nature. Really enjoy watching NHL with the family.” Another shared a similar sentiment. “NHL is quick paced and hard hitting. Lots of energy goes into hockey. It’s a fun sport to attend as well as to watch from home.” The NHL also ranks very highly on “Action,” “Pace / Speed,” and “Drama.”
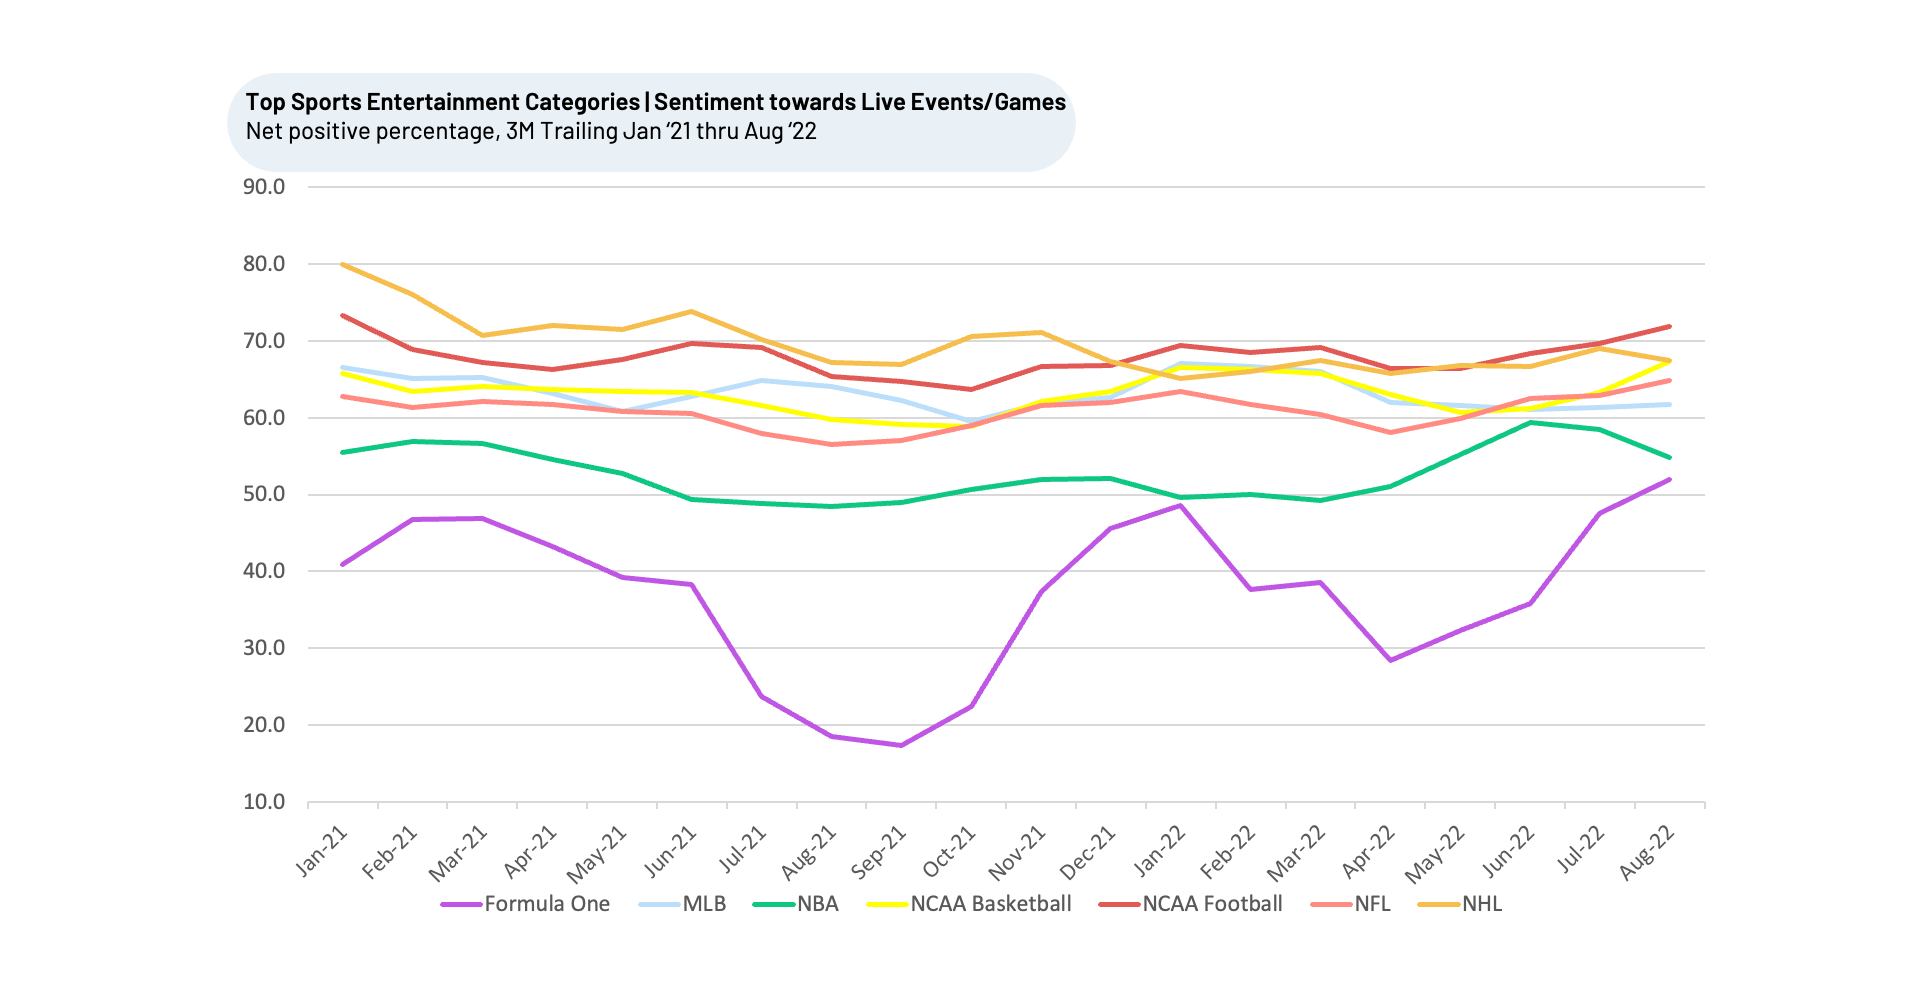
Live Events and League Games
NCAA Football holds the top spot in “Live Events / Games” Customer Satisfaction with an NPP of 72% for T3M August 2022, well ahead of the peer average 61%. It has remained within near the top of the group since January 2021. NCAA Basketball, meanwhile, is tied with the NHL for second with an NPP of 67% for T3M August 2022.
Part of the reason may be game schedules. NCAA Football takes place on Saturdays instead of Sundays, allowing more people to travel to games. Competitions are often held on college campuses, are attended by people with deep ties to the school and are often younger on average than the people who attend professional games. One person told HundredX, “I love college football. Brings a lot of things to community, tailgate being one.” Another added, “The rivalries and fan support make just about all the NCAA football games exciting...”
Formula One: The Breakout Star
The last three months have seen Formula One rise to having the biggest jump in NPI. Similarly, Formula One’s revenue hit $744 million in Q2 2022 ― a growth of 49% compared to the same time last year. The surge in the demand growth outlook corresponds with sharp improvement in relative sentiment from “The Crowd” for all of the top drivers we just covered.
For “Athletes / Sports” sentiment, Formula One made a steep jump from an NPP of -19% in T3M May 2022 to -3% T3M August 2022. Similarly, for “Entertainment,” Formula One’s NPP moved from -15% T3M April 2022 to -6% T3M August 2022. Looking at “Live Events / Games,” Formula One spiked from -28% T3M April 2022 to -8% T3M August 2022. It made similar progress in other drivers, including “Action” and “TV Presentation.”
The moves correspond to the Netflix show “Formula 1: Drive to Survive,” released in March 2022, just before the season’s start. According to Netflix’s data, the season was viewed for more than 28 million hours within a few days of its release, putting it on the company’s top-10 list. The NPI for Formula One similarly spiked in our data for T3M March 2021, when Netflix released the third “Formula 1” season.
“Drive to Survive was the best thing to happen to America’s consumption of F1,” one person said to HundredX. Another said, “(I) have really enjoyed it since COVID and Drive to Survive. (I) love following the drivers.”
Strategy Made Smarter
HundredX
works with a variety of companies and their investors to answer some of the most important strategy questions in business:
- Where are customers "migrating"?
- What are they saying they will use more of in the next 12 months?
- What are the key drivers of their purchase decisions and financial outcomes?
Current clients see immediate benefits across multiple areas including strategy, finance, operations, pricing, investing, and marketing.
Our insights enable business leaders to define and identify specific drivers and decisions enabling them to grow their market share.
Please contact our team to learn more about which businesses across 75 industries are best positioned with customers and the decisions you can make to grow your brand’s market share.
HundredX is a mission-based data and insights provider and does not make investment recommendations. We believe in the wisdom of "the Crowd" to inform the outlook for businesses and industries. For more information on any of these sectors within Sports Entertainment, and any of our 75+ industries, or if you'd like to understand more about using Data for Good, please reach out: https://hundredx.com/contact
Share This Article