Industry Update: New Data Reveals what Music Streamers Really Want
Where do you listen to music? Maybe it’s at work, or maybe in the car. Maybe you listen while relaxing in the evening or while singing in the shower. Whatever the answer is, you most likely listen to music somewhere.
Surveys¹ have found that almost all Americans listen to music, and, on average, they listen to about 20 hours a week. Almost half of U.S. music listeners use subscription audio streaming services.
With that in mind, HundredX wants to share insight into who these people are, and what they want to see in a music streaming service.
We looked at more than 375,000 pieces of feedback for all home entertainment from February 2022 through February 2023, including 50,000 pieces of feedback across 11 music streaming brands, to find:
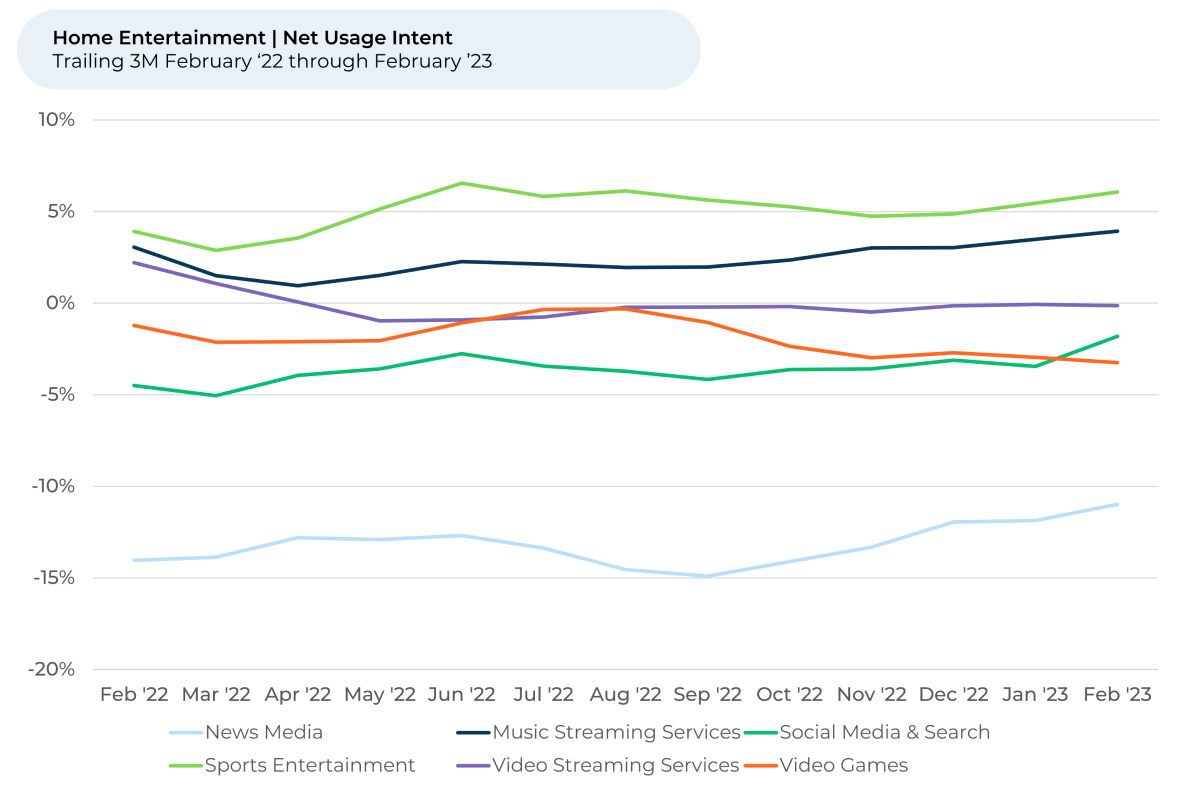
- Most home entertainment industries are poised for growth, with Usage Intent² rising the most for music streaming and news media the last six months and falling for video games.
- Usage Intent for Spotify increased modestly in recent months, keeping Usage Intent for the music streaming service highest among competitors. However, YouTube music is swiftly gaining on Spotify.
- Usage Intent for 18-29-year-olds is highest for Spotify, while YouTube is highest for 30-39-year-olds. Spotify’s student discount pricing seems to be a win with younger consumers.
- Usage Intent for music streaming is highest, and increasing, for lower-income households.
- YouTube Music saw gains in sentiment³ towards music selection, ease of use, and sound quality in recent months, indicating Alphabet’s investments in the service are paying off.
Over the past year, Usage Intent for home entertainment industries has largely stayed within a range. Over the past few months, however, Usage Intent has been on an upward trend for music streaming, sports entertainment, news media, and social media and search. It has fallen for video games and stayed stable for video streaming.
Price might help to explain why Usage Intent is higher for music streaming than most other types of home entertainment.
Customers of music streaming services feel more positively about pricing than those that use video games, video streaming, and news media platforms. Customers feel least positive about the prices of video games. Most music streaming services can be used for free, albeit with limited capabilities. Customers alternatively can subscribe to them usually for $10 - $15 per month – this option is perhaps why customers also feel most positively about music streaming’s subscription options. Meanwhile, most big-name video games cost $60 - $70 dollars each.
“Absolutely the best way to listen to a ton of music. Even free, this is a great app even with the ads,” one Spotify user told HundredX. Many other feedback respondents left similar comments on other music streaming services.
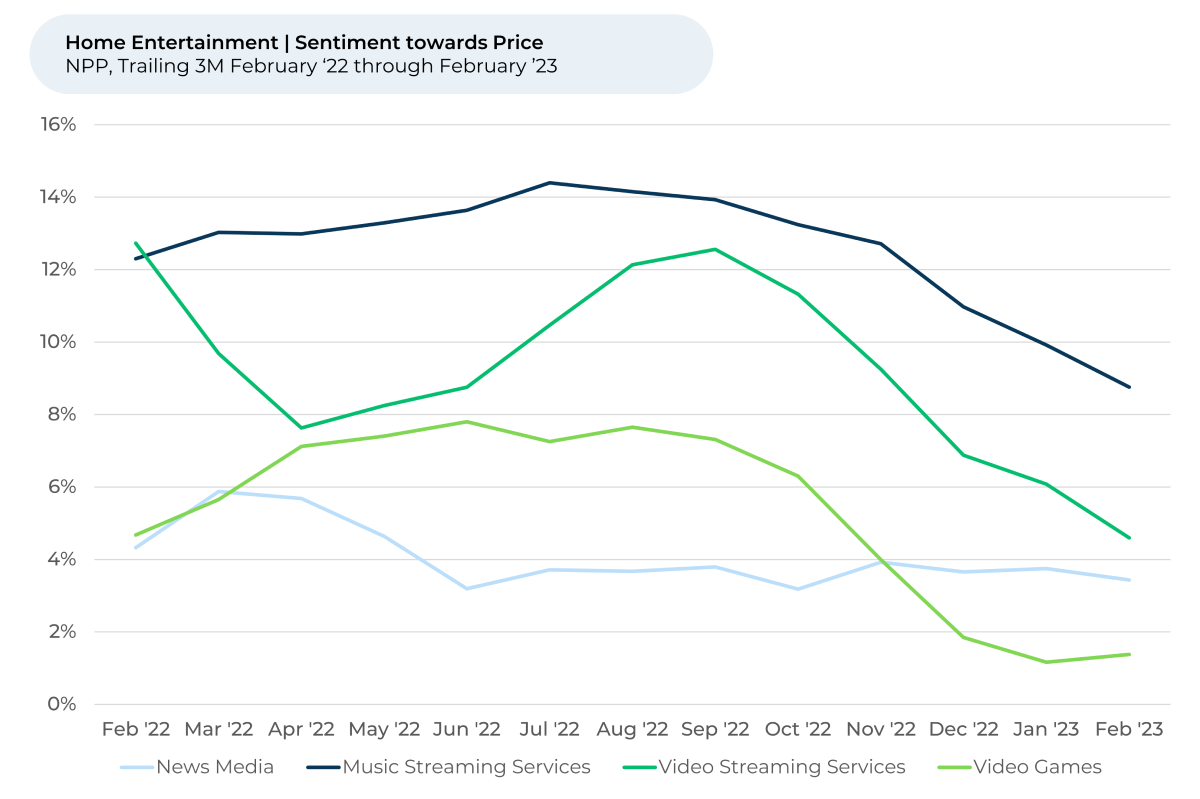
Still, sentiment towards price has fallen for home entertainment industries over the past 3-6 months. It fell the most (-8%) for video streaming, likely indicating that customers aren’t happy with many
services’ recent price hikes.
Spotify vs YouTube Music
Even with sentiment towards price falling, music streaming is staying strong on Usage Intent, a trend powered by a few major streaming services.
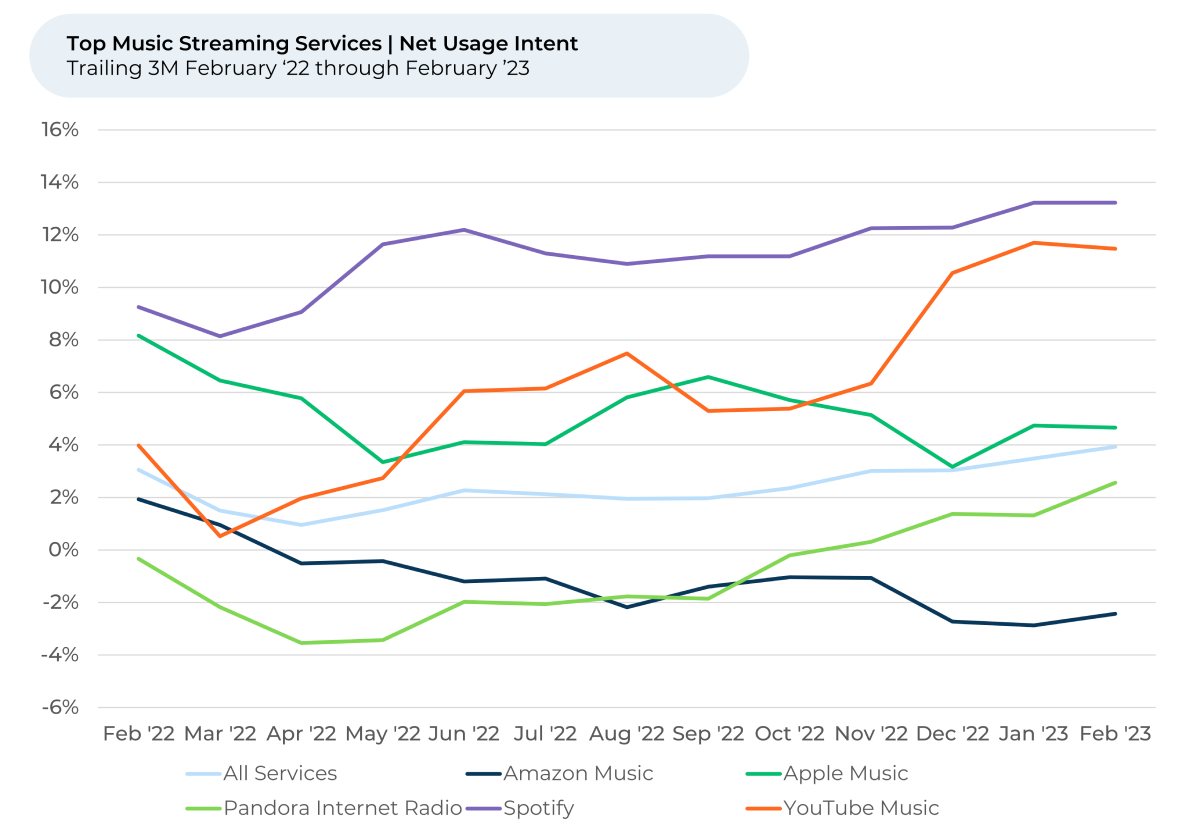
Spotify, YouTube Music, and Pandora, three of the biggest music streaming services in the U.S., all gained in Usage Intent in the last three months.
Compared to its biggest competitors, YouTube Music appears best positioned for growth. Usage Intent for the Alphabet-owned music streaming service increased by 5% over the past three months and 7% over the past year. While Usage Intent is still the highest for Spotify, the gap between it and YouTube Music has closed significantly since the fall of 2022.
Spotify has more paid subscribers, while YouTube Music has more users overall. Alphabet reported that YouTube Music and Premier had 80 million global subscribers in November 2022, an increase of 60% from the year before. Meanwhile, Spotify reported more than 200 million subscribers as of December 2022.
However, YouTube Music has a bigger pond of non-paying users to draw from. YouTube, the free version, has more than 2 billion monthly logged-in users. The free version of Spotify sees more than 480 monthly active users.
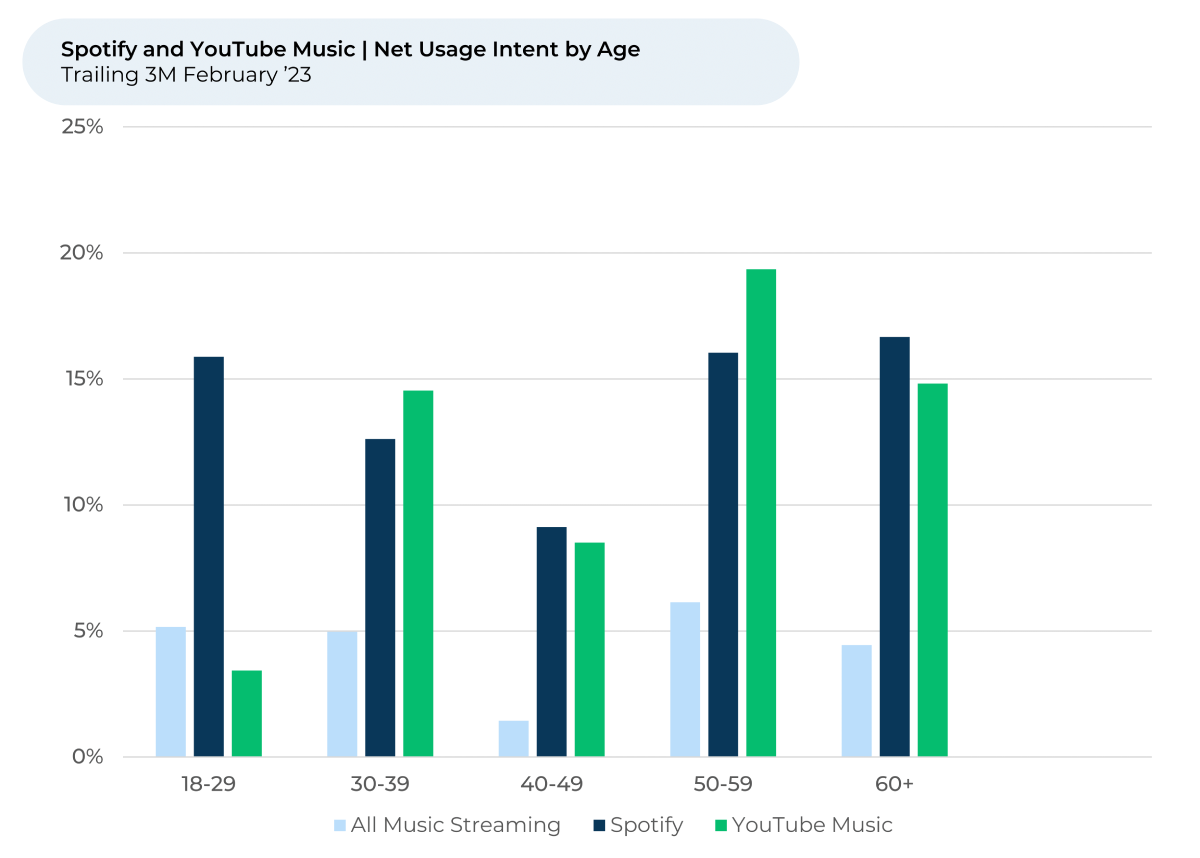
It appears YouTube Music and Spotify appeal to different age groups. Spotify has the highest Usage Intent across most age groups and has the largest advantage with the 18-29 segment. Spotify’s student discount, which offers Spotify Premium, Hulu, and Showtime for $5 per month, seems to be a win with younger listeners.
“The student discount is really helpful for kids in college, it shows that a company knows its audience and treats their customers well,” a Spotify listener told HundredX.
Another feedback respondent said “I love the Spotify bundles w/ Hulu & other streaming services. I think it’s great they offer student discounts as well. Their app is so easy to use & I’ve been a fan since high school.”
YouTube Music outpaces Spotify and other competitors for 30-39-year-olds and 50-59-year-olds.
That’s important, as older customers appear poised to drive growth for music streaming services.
Over the past three months, Usage Intent for people aged 50-59 rose 3% for all music streaming and Spotify, and 15% for YouTube Music. Since February 2022, Usage Intent for people over 60 rose by 3% for all music streaming, 9% for Spotify, and 7% for YouTube Music.
Interestingly, Usage Intent slightly shrunk for all music streaming, Spotify, and YouTube Music over the past year for the youngest age group – people between 18 and 29.
Why are Spotify and YouTube Music coming out on top?
Customers of Spotify and YouTube Music appear to love their music selections and their ease of use. They feel happy about their sound quality, apps, navigation, and personalization. We found music selection, ease of use, and sound quality are the top three reasons why people like or dislike a music streaming service.
YouTube Music, by allowing users to play YouTube videos and add them to their libraries and playlists, has the largest music selection out of any of its competitors. Meanwhile, Spotify, with more than 100 million tracks and 5 million podcasts, has perhaps the largest collection of original content.
“(I) like being able to listen to the oldies in the background while playing games or working on projects. Can hear some tunes that are no longer available on other platforms,” one YouTube Music listener told HundredX.
YouTube Music continued to make significant gains in sentiment towards the top three factors over the past year, with sentiment rising 8% - 10% for each of them. Over the past three months, sentiment towards music selection, sound quality, and the app rose by 2%.
Alphabet has made significant improvements to YouTube Music in recent months, including introducing a new way for users to create a radio station based on the content they like, a redesign of its library tab on mobile apps, the ability to filter music by mood on the web app, and better controls to cast content from a mobile device to a TV.
“I enjoy using YouTube Music for the simple fact that I can personalize my own radio stations,” one person recently told HundredX.
Spotify made more moderate gains in sentiment towards music selection and ease of use (+5%) over the past year.
“Spotify is the go-to app for music. They have it all, from podcasts to songs. I’m always excited about my year review of music,” someone told HundredX.
However, YouTube has narrowed the spread in sentiment with Spotify on almost all the drivers of customer satisfaction that we track over the past three months, potentially explaining why YouTube Music has significantly closed its gap in Usage Intent with Spotify since November.
As 2023 barrels on, HundredX will continue monitoring the music streaming space to share which customer groups are most poised to create growth for services and why. By understanding this, businesses can better market their services and adjust their services that will appeal to customers.
- A 2014 Nielsen study found that 93% of Americans listen to music. A recent 44,000-person survey from the International Federation of the Phonographic Industry (IFPI) indicates that more than two-thirds of people say music is important to their mental health. The survey found that, on average, American music fans listen to 20.1 hours a week. IFPI also notes 46% of its survey respondents use subscription audio streaming services.
- Usage intent reflects the percentage of customers who plan to use a specific brand during the next 12 months minus the percentage that plan to use less. All metrics presented, including Net Usage Intent (Usage Intent), and Net Positive Percent / Sentiment are presented on a trailing three-month basis unless otherwise noted.
- HundredX measures sentiment towards a driver of customer satisfaction as the percentage of customers who view a factor as a positive (reason they liked the products, people, or experiences) minus the percentage who see the same factor as a negative.
Strategy Made Smarter
HundredX works with a variety of companies and their investors to answer some of the most important strategy questions in business:
- Where are customers "migrating"?
- What are they saying they will use more of in the next 12 months?
- What are the key drivers of their purchase decisions and financial outcomes?
Current clients see immediate benefits across multiple areas including strategy, finance, operations, pricing, investing, and marketing.
Our insights enable business leaders to define and identify specific drivers and decisions enabling them to grow their market share.
Please contact our team to learn more about which businesses across 75 industries are best positioned with customers and the decisions you can make to grow your brand’s market share.
####
HundredX is a mission-based data and insights provider. HundredX does not make investment recommendations. However, we believe in the wisdom of the crowd to inform the outlook for businesses and industries. For more info on specific drivers of customer satisfaction, other companies within 75+ other industries we cover, or if you'd like to learn more about using Data for Good, please reach out: https://hundredx.com/contact.
Share This Article